Visual Impressions
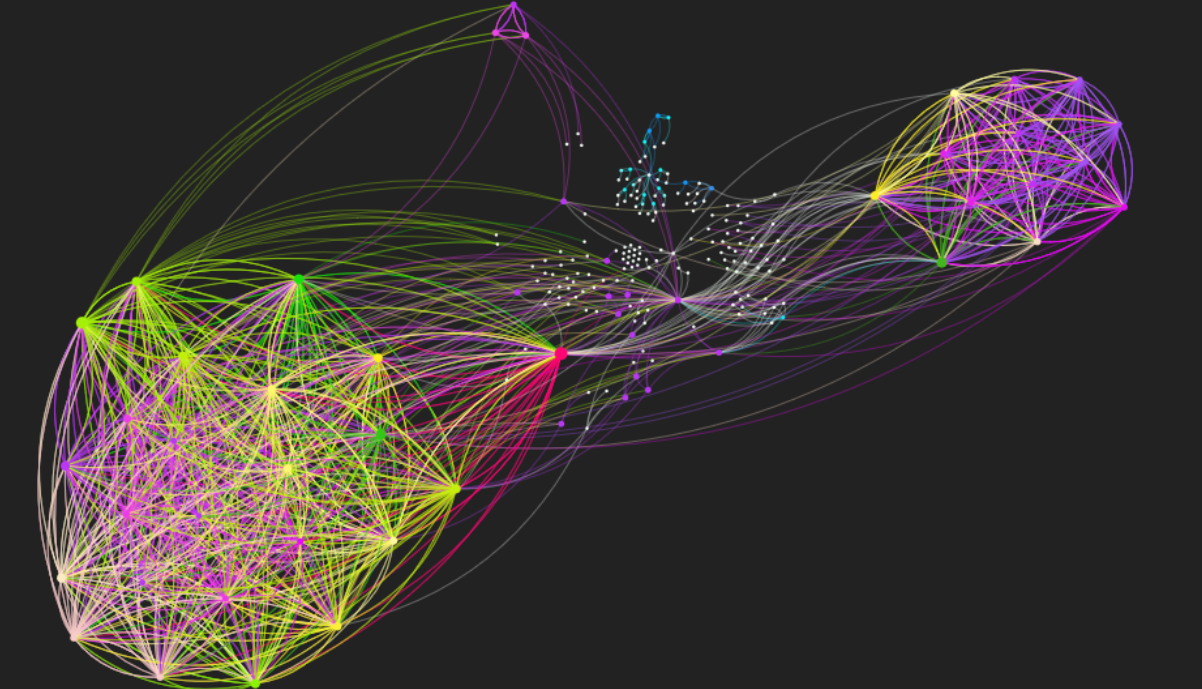
With the help of Gephi and the plugin SemanticWebImport, I have created two visual representations of one and the same subgraph for reasons of clarity based on the "aim:" namespace only. We realize immediately - and much better than from forms - the knowledge concentration about the semantic web technologies on the left, the machine learning on the right and the connecting concepts in between. From this, we may conclude: Due to the imbalance, the system should at least know (automated learn?) more about the topic "Machine Learning". For clustering, the Force Atlas algorithm was used. The node sizes were statistically calculated and visualized using the ranking of Betweenness Centrality.
[Click onto the pictures to enlarge them; click onto the titles to see more.]
Visual Impression as an Art
To generate this visual, somehow art-like representation, the plugin Loxa Web Site Export was used and the generated web sites in some places simplified to the needs for this application. [Select the title above.]
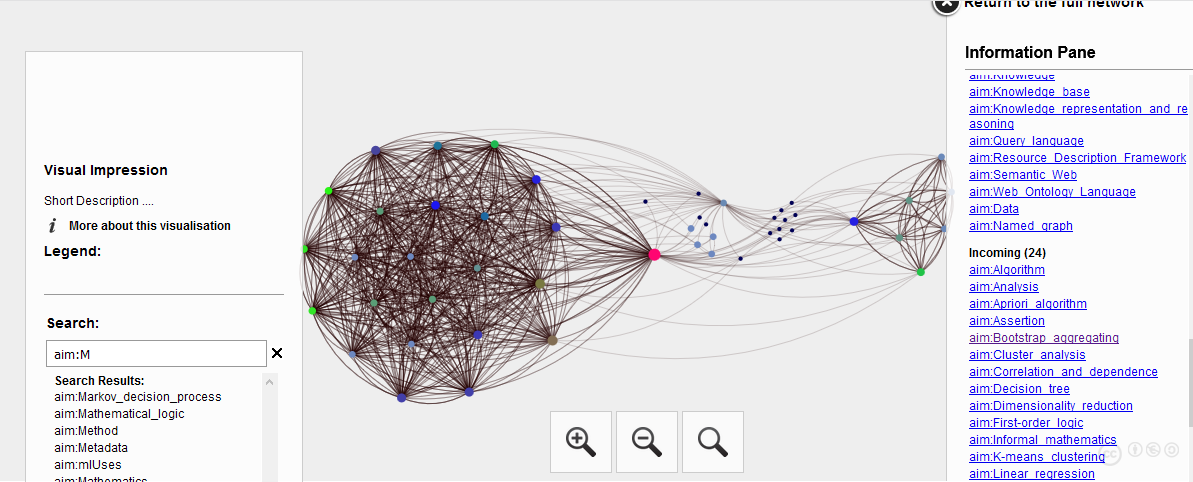
Visual Navigation
To get a better orientation about the AI Knowledge-Graph and to be able to navigate visually, the Gephi plugin SigmaExporter was used to generate the needed webpages and scripts. [Select the above title.]
After typing in at least 3 characters in the Search box on the left (e.g. "aim:A" and ENTER) and selecting a term, the dependent subgraph will be drawn. These are the dependences of the selected term (=concept) in respect to other terms. After the selection, on the right hand side the Information Pane opens containing statistical information about the searched term. As soon as you drive over the searched term in the information pane, the term will be located in the graph. In the lower area of the Information Pane (scroll down), all existing incoming and outgoing as well as mutual connections from and to other terms are listed. Thus, you can easily navigate to other, dependent terms and recognize further subgraphs or even realize missing subgraphs to be created. -
Unfortunately, I was not able to selectively show the names of the individual predicates (compounds) in both graphs.